Ever st op to consider how the ever present changes going on around you make your own transformation easier?
John Hagel relatively recent blog post describes the opposite.
In a world of accelerating change, one of our greatest imperatives is to “unlearn” – to challenge and ultimately abandon some of our most basic beliefs about how the world works and what is required for success.
Accenture a few years ago noticed that many different companies had shifted their approach to strategy. Perhaps, the availability of cheap, powerful computing capacity and Big Data are responsible for driving changes in strategy development as more organizations using technology find it easier to build consideration of the future into their present planning. Hagel, a long time fan of scenario planning would applaud these efforts too.
With the rise of automated business processes, analytics too get incorporated automatically to enhance decision making and may be simultaneously compromising management capabilities to internalize all of these changes or understand the underlying dynamics traditional measures mask. Several articles provided case studies in different industries provided the basis of discussion around transformation (see the bottom of the post for specific article links).
 Successful organizations rely on their strategy to put forward action plans, realize new ideas while averting risk. Statesmen and management alike find themselves in precarious places when they assume a trend will continue without change. Many statistical methods and decision-makers use of data remain unchanged from 1954 when Daniel Huff first published How to Lie with Statistics. His timeless book describes very simply the perils of improper use of methods that were designed to capture and explain if not contextualize the significance of singular observations, or data. The current transformations enabled by technology have done more to alter behavior than organizations seem to recognize. That’s the path our discussion took.
The capability for insight
Prospective vs retrospective cohort analysis and data mining techniques are far from new. Though the volume and speed of available data to digest and process with ever The increasingly sophisticated tools and the ease with which volume and speed of available can be processed may help as well as hinder their digestion. Sure the time to test alternative scenarios may be faster, but how do you choose the model?
Do you begin with the intended outcome? The scientific method and numerous models from multiple disciplines make it possible to isolate factors, determine their significance, and estimate alternative scenarios and assess how these variations produce changes in impact.
Similarly, the cross pollination of data modeling from one discipline into multiple industries and use cases continue to shift management beliefs regarding the importance of specific factors and interactions in their processes. The perennial blind spot denies many organizations and their leadership the insight necessary to transform both their internal strategic thinking process and business operating models. Last month’s discussion of McDonald’s and Coca-Cola illustrated how easily leadership misinterpreted fluctuating performance as temporal issues versus recognizing structural factors. It’s one thing to balance efficiency and effectiveness, quality and satisfaction and another to manage awareness of change and insights necessary to your continued survival.
What else thinking
“…both the digital world and the physical one are indispensable parts of life and of business. The real transformation taking place today isn’t the replacement of the one by the other, it’s the marriage of the two into combinations that create wholly new sources of value. “
The sudden availability of online data tracking provided many organizations with the proper capability to understand user behavior differently. A whole new industry arose to focus on interpretation while creating of new measures while also introducing new thinking about effectiveness in sales, customer service, training etc. Metrics, once created to prove out a strategy or an idea, now leave many organizations vulnerable until they build up the capacity to understand this new thinking let alone make corresponding operational changes necessary to sustain their business.
This is not the story of companies who fail to adapt such as Kodak who invented digital cameras only to retain their focus on film; but maybe it is.
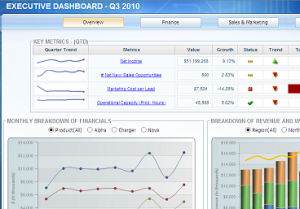
 Computerized reporting dashboards summarize specific indicators or activity associated with managing process or business relevant factors. The time and reporting cost savings that result from the automatic generation and ready access to information by managers and executives reinforce existing thinking and leave little room for understanding wider changes that may be impacting their business. It wasn’t long ago that analysts, and teams of them, spent their entire day pulling data and then calculating critical statistics detailing the effectiveness and efficiency of organizational activities to create reports for senior management. These efforts also made them accountable by insuring the data was clean, verifying whether outliers were real or indicative of a model failing to fully capture the wider dynamics. I was once one of those managers. Today, automated reporting has eliminated many of the people capable of deeper data exploration and who chose what data, which statistics and the context necessary to understand the situation. The second problem is that data shared graphically or in tables never tell the whole story, though infographics do try.
A good analyst is taught to review the data and results, double-check whether the model or calculated results makes sense. Sure managers and executives may be quicker to detect aberrations and then raise questions but , how many of them have the time, patience or skills to test their ideas or intuitions? I imagine very few if any. Where are these available resources and how widely known are they to questioning executives? How might the dashboard provide additional information to help frame the results executives see as they too seek to understand or make sense of the results?
Outside in thinking
Established data flow processes and automated reporting do deliver great advantages but they may also explain why outsiders find it easier than insiders to create new business models. Where’s the out of the box thinking? And how can different data help?
Sure, it’s easy to blame regulatory requirements or compensation structures incentivized to focus on effectiveness and efficiency that leave little latitude to notice opportunity. For example, in the airline industry route fares were once set by regulations. The minimum fares were intended to cover airlines operating expenses that both insured passenger safety and access to air travel in more locations where market forces may lead airlines to cut corners. Deregulation may have given airlines additional freedom but many manage their business using the same metrics that they report to the Department of Transportation. Likewise in Healthcare, the imposition of new regulatory requirements came with new metrics that forced hospitals to focus on patient outcomes not just their costs.
When executives bottom line focus limits their thinking as an exercise in how making corrections in operation may maximize that number they overlook other contexts. Data quality issues should surface quickly in most organizations, but what if another factor created the data issue? A misplaced data point, or inconsistent treatment of the content of a data field rarely explain all aberrations in the results. Weather, for example exemplifies a ubiquitous, exogenous variable. Observable data fluctuations may be directly or indirectly responsible by affecting other more directly connected factors, such as a snowstorms that change people’s activity plans. I’m not familiar with any automated reporting system that will automatically create a footnote to the data point associated with the arrival of a snowstorm. The reviewer is forced to remember or manually if possible add the footnote for others.
Bigger transformations to come
Bain believes there are significant implications for every organization that result from this digital and physical combination of innovations , they call Digical. It’s not easy to keep up with the corresponding behavioral shifts that result from these rapidly changing technological capabilities.
Focusing exclusively on efficiency and cost data helped management measure impact in the old era, though still necessary today they may no longer suffice. Do you know how social behaviors of your customers impact your bottom line? The technologies to support your business, such as your website or your cash register misses out on the social behaviors evident on sites like Facebook, Twitter, Yelp or even their bank. Mapping the ecosystem and then aligning the digital tracking data can now be supplemented with sensor data that may be anonymous to specific customers but can inform movement and actions relevant to your engagement.
Naturally, as mentioned earlier bias plays a role in our inability to notice the significance of new data. The more we automate and configure systems to measure what we always knew mattered, the less likely we are to be able to recognize new data and its significance. What should you the analyst and you the executive do to counteract these factors?
Takeaways
Monitor the activity of smaller companies as they experiment to learn what’s most relevant.
Don’t make assumptions, exercise strategic intentions to become more open receptive and curious about anomalies and be more creativity and persistent in identifying the drivers or possible factors.
Historically, metrics were an output designed to assess the validity of your strategy –did it work and/or deliver value. Not it’s time for strategic thinking to view metrics as an input. The use of statistics enabling analysis tools partnered with business knowledge and acumen must be part of communicating to higher levels in the business.
Often we measure the wrong things because the incentives are misaligned. Am I paid based on my proven ability to produce widgets at specific levels , or to produce effective, sustainable results for the business, not just my business unit?
Computers are useless they can only give you answers. For strategy, validating the questions may be important but so too is taking the time and effort needed to determine even better questions.
ARTICLES
Alternative case examples
Bain’s study and understanding of the state of “digical” transformation:
http://www.bain.com/publications/articles/leading-a-digical-transformation.aspx#sidebar
Fast Food
http://www.qsrmagazine.com/reports/drive-thru-performance-study-2014
Wireless
http://www.rcrwireless.com/20140812/opinion/reality-check-new-metrics-for-a-changing-industry-tag10
Television
http://fortune.com/2014/10/23/adobe-nielsen-tv-ratings-system/
Gaming
http://www.gamesindustry.biz/articles/2014-03-10-social-currency-has-real-value
